It was there as the Torrence family was terrorized in Stephen King's The Shining:
The hummings and clankings and thumpings were louder here, terrifying in a disconnected, benumbed way. Jack was staring at the closed door with feverish intensity. Through the diamond-shaped window in the center of the elevator door she thought she could make out the cables, thrumming slightly. The elevator clanked to a stop below them, at lobby level. They heard the doors thump open.
It was there when Sheriff Holston exited the silo in Hugh Howey's Wool:
Holston found himself at the bottom of a concrete ramp, a ramp that led up. His time felt short—there was a constant reminder thrumming in the back of his skull—hurry! Hurry! His life was ticking away.
It was there when physicist Jason Dessen was abducted in Blake Crouch's Dark Matter:
It's so quiet in the car I can actually hear my pulse—a fast thrumming against my eardrum.
It seems that whenever I open the pages of a book it's lurking in there somewhere: the word "thrum".
Yet, narrated books aside, I've never heard this word spoken out loud by anyone in real life. Not in personal conversation. Not in TV shows or movies. Not in lectures or interviews. But it's constantly there on the written page.
It's in thrillers, like Michael Crichton's Micro:
Rick and Karen reached the circle. They could hear a deep thrumming sound—the pulse of robot propellers around them.
And detective novels like Ben Winters's World of Trouble:
I swing around, moving quickly now, heartbeat thrumming...
It's in David Byrne's sonic exploration, How Music Works:
Rhys Chatham and Glenn Branca created similar soundscapes for massed guitars—wonderful experiences that evoke the thrum of a highway overpass or a steel foundry.
And the social science research of Jean Twenge's iGen:
Many parents and educators worry that teens' constant smartphone use, especially the constant thrum of social media and texting, has created an emotionally fragile generation prone to depression.
It's in Andrew Ross Sorkin's economic history, 1929:
He made his way into the entrance of 23 Wall Street, picking his way through the crowd of men wearing rumpled clothes from sleeping in hotel lobbies or on park benches the night before, not a few still drunk from making the rounds at the city's main speakeasies. Safe inside the second door, Lamont heard the thrum of a thousand conversations, people trading rumors.
And it's even in memoirs about atomic toilets*:
The restrooms at Bishop's had the world's only atomic toilets—at least the only ones I have ever encountered. When you flushed, the seat automatically lifted and retreated into a seat-shaped recess in the wall, where it was bathed in a purple light that thrummed in a warm, hygienic, scientifically advanced fashion, then gently came down again impeccably sanitized, nicely warmed, and practically pulsing with atomic thermoluminescence.
To play or pluck a stringed instrument idly: strum
The sense of the word as playing an instrument is illustrated in Mick Herron's Spook Street, where neurotic MI5 agent J.K. Coe plays the air piano on a bus:
Coe wasn't sure when this had begun. It hadn't been a conscious decision to mime his way through a series of improvised piano recitals... he noticed that the young woman next to him was edging away, casting worried glances at him, at his fingers, which were thrumming a non-existent keyboard.
And you only need to advance 10 more pages to find an example of the other sense of the word, when agent Louisa Guy sits at her window:
Sometimes at night she'd sit with the curtains open, a glass of wine in her hand, looking down on trees waving in the wind... glad she was there and no longer in her poky studio with its constant cooking odours, and heavy bass noises thrumming from passing cars.
The earliest known uses of "thrum" as a verb are from the late 1500s. It's an imitative or onomatopoeic word and is a variation of "hum" and "strum". Those other words are more popular in print, though "thrum" has been on a bit of a rise this century.
I've heard people say "hum" a million times. I've heard people say "strum" plenty as well. I've heard "buzz", "drone", "vibrate", "pulsate", and "resonate". But I've never once heard anyone say "thrum".
Sure, written language is always going to have more ten-dollar words than spoken language. I've never heard anyone say "crepuscular" or "languorously" in real life either. But "thrum" is short and simple. It's in just about every other book I read. It could easily catch on. But it doesn't.
"Thrum" is a weighty, descriptive word reserved for storytellers. A sometimes soft, sometimes loud, sound in books, not aloud.
* Bill Bryson's *The Life and Times of the Thunderbolt Kid*
One reason for this is that people are living longer. Baby boomers began to enter adulthood in 1964. Life expectancy has increased by about 10 years since then. Older adults are now "aging in place," living in their homes and staying independent for as long as possible.
Another reason for the age shift is that more young people are going to college. College enrollment has grown from 45% in 1960 to 63% today. A larger proportion of young people are deferring their first home purchase until after they've finished their education, which pushes the median homeowner age upward.
College enrollment rates of recent high school completers, 1960–2024
While there has been a decline in homeownership rates for most age groups in recent decades, this has been a gradual change with ups and downs. 35- to 45-year-olds have seen the largest drop. For homeowners under the age of 35, annual homeownership rates have remained relatively flat, hovering around 40% since 1970.
For homeowners under 35, the 2025 rate is nearly identical to what the rate was during a downturn back in the mid 90s.
Age
1994
2025
65+
77.4%
78.6%
55–64
79.3%
75.9%
45–54
75.2%
69.8%
35–44
64.5%
60.8%
< 35
37.3%
37.0%
A more granular breakdown of homeowners under the age of 50 shows that things have been improving since a low point in 2016. Younger householders have been fueling that increase, and those under 25 have actually been doing better this century than in the 1980s and '90s.
Homeownership Rates for Owners Under Age 50, 1982–2025
For over forty years now the ownership rate has shown a consistent pattern of being higher for older age brackets. This makes sense. As people age, they tend to learn new skills, gain more experience, and earn more money. They've also had more time to save for a down payment. That was true in the 1980s and it's still true today.
Here again is a comparison of the current rates with 1994, this time broken down by homeowners under age 50. The rates are slightly lower for most age groups, though they have improved for those under 25.
Age
1994
2025
45–49
73.8%
68.5%
40–44
68.2%
64.4%
35–39
61.2%
57.4%
30–34
50.6%
46.6%
25–29
34.1%
33.3%
< 25
14.9%
24.2%
First-Time Homebuyer Age
In late 2025, many news outlets cited a National Association of Realtors (NAR) survey which estimated that the median first-time homebuyer age had reached an all-time high of 40. However, NAR's data is out of line with Census Bureau data and according to Redfin the "typical first-time homebuyer was 35 years old in 2025, down from 36 the year before and down from a peak of 38 in 2018."
The American Enterprise Institute puts the number even lower. Using anonymized mortgage loan data to determine the median age of first-time homebuyers, they estimate that for the first quarter of 2026 the median age of first-time buyers obtaining a loan was 33. Loan data also show that the median age of first-time homeowners has been under 35 for the past twenty years.
Affordability
So far we've seen that the median homeowner age has risen slightly in the past 30 years, young people are still buying homes at roughly the same rate they always have, and Census and loan data show that first-time buyers still tend to be in their mid-thirties. What about cost?
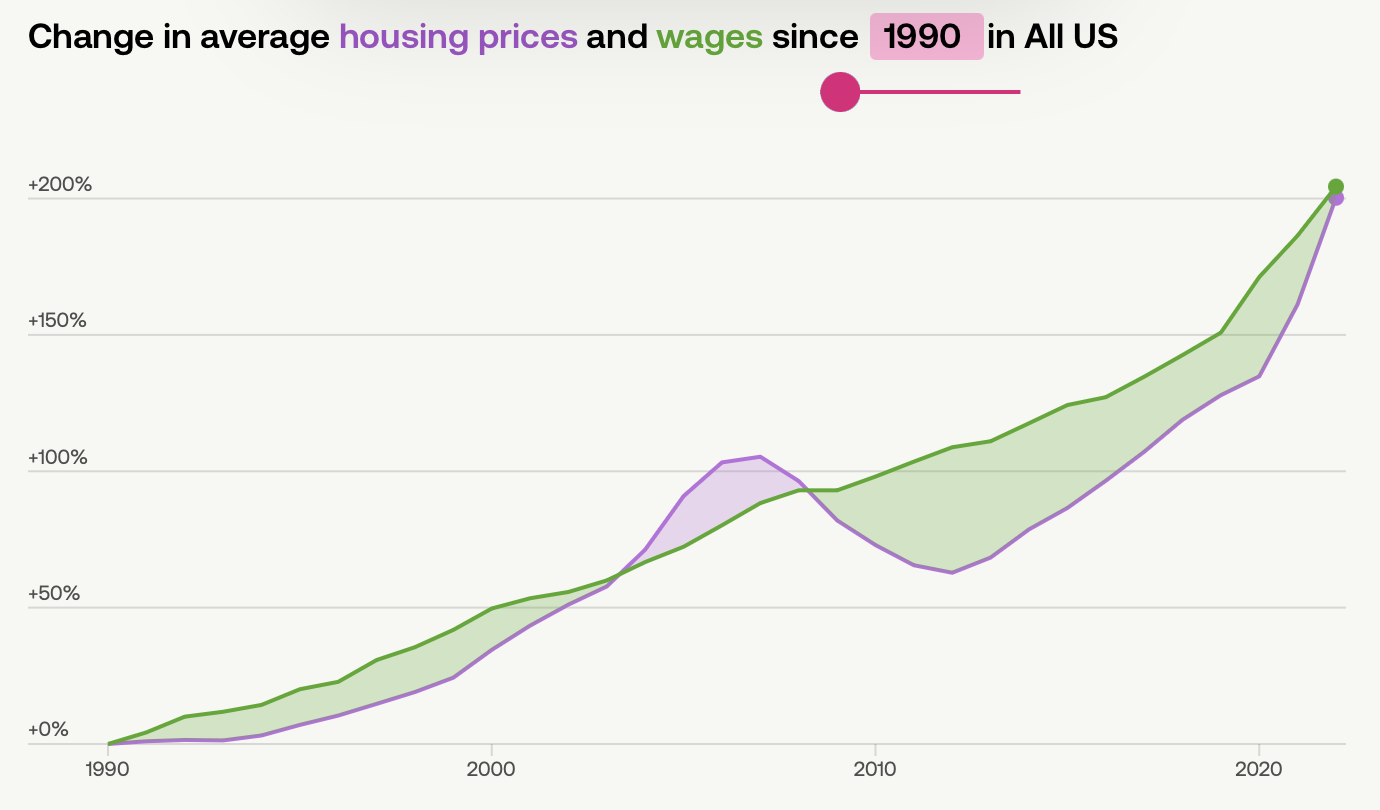
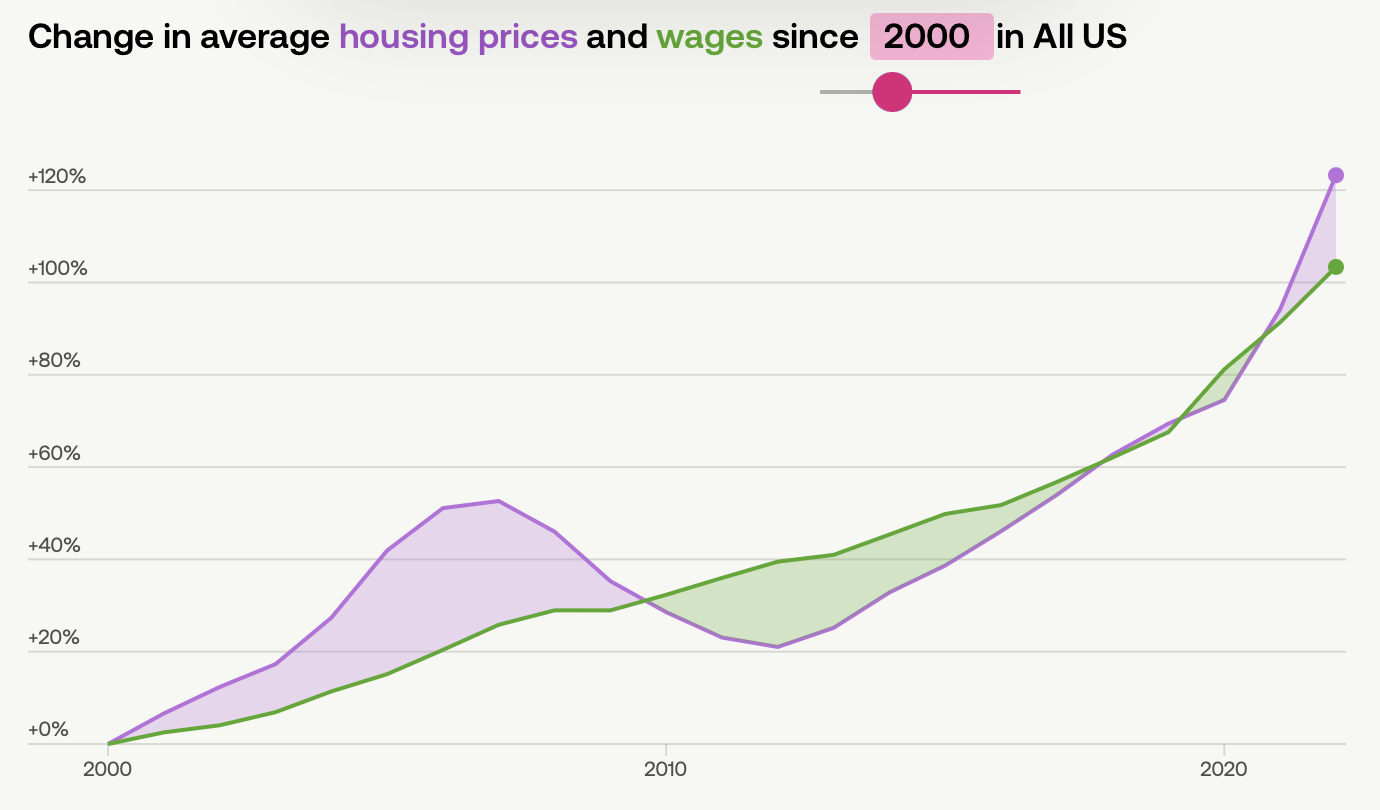
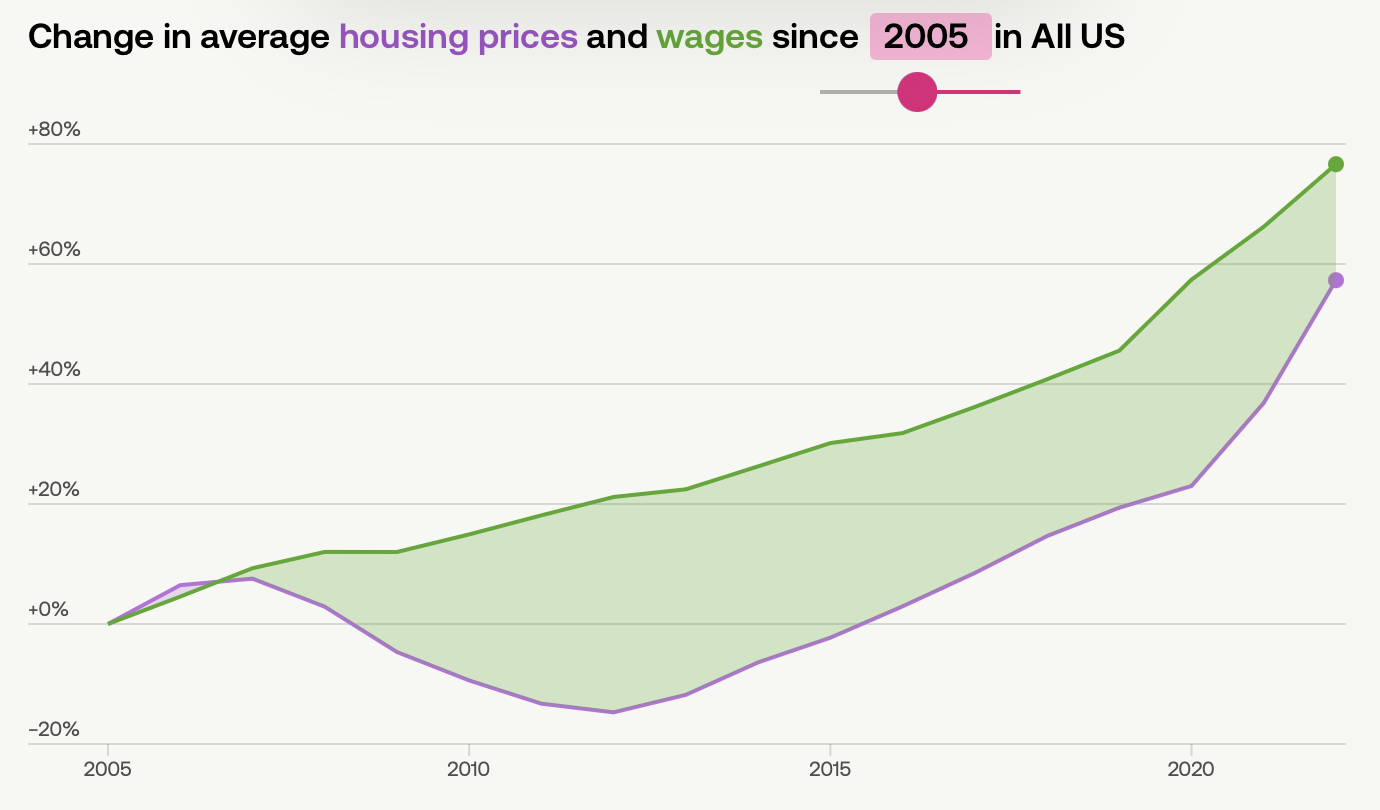
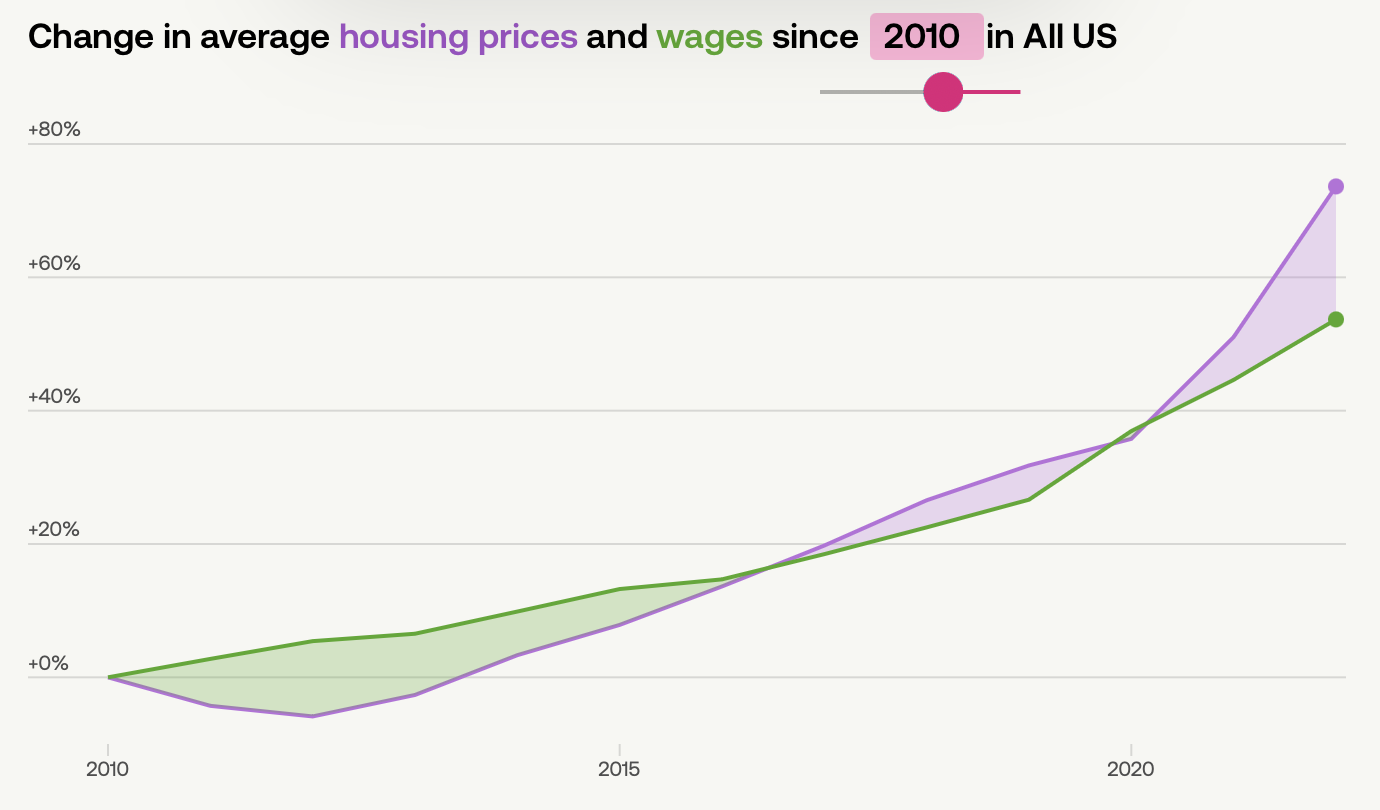
The Federal Housing Finance Agency's (FHFA) House Price Index (HPI) measures the average price changes in single-family homes. HPI measures the rate of appreciation or depreciation rather than a specific dollar amount. USAFacts has some great interactive charts comparing the changes in HPI and wages over time.
If you start the clock in 1990, changes to wages have outpaced house prices:
Change in Average Housing Prices and Wages since 1990
And so far, that trend has continued ever since. Even though housing costs have been outpacing wages for over 15 years now, does this mean that mean that homes are unaffordable or "impossible" to purchase?
One way to try to measure affordability over time is to examine the price-to-income ratio. The median home price was about 4 times the median household income back in the late '80s and early '90s. It's about 5 to 6 times the median household income today.
Ratio of Median Sales Price to Household Income, 1984–2024
You'll sometimes see this metric in stories about how housing is becoming unaffordable. But there are several problems with using price-to-income to gauge affordability.
First, housing prices and incomes vary greatly by region. In the Midwest, median home prices tend to be lower, and median incomes tend to be higher than the national values. If we compute the price-to-income ratio just for the Midwest, then the upward trend is much more gradual. For the Midwest the median home price was 3.3 times the median family income in 1993, and it still was in 2020.
Ratio of Midwest Median Sales Price to Midwest Family Income, 1984–2024
The second and more important problem with the price-to-income ratio is that it doesn't take into consideration the impact of lending costs. Mortgage rates have an enormous impact on the actual cost of purchasing a home.
The average mortgage rate in 1984 was 13.88%. The median home price was $79,900. Even with a down payment of 20%, the total interest owed on a 30-year loan was $206,549 which is 2.6 times the home price itself.
The average mortgage rate in 2025 was 6.66% and the median home price was $417,400. If a buyer took out a 30-year loan with a 20% down payment, then the total interest would be $438,590 which is 1.1 times the home price.
While it's true that loans can be refinanced over time, most of the interest is paid on the front-end. At a rate of 13.88%, in the first year of payments, $8,863 goes toward interest and just $153 goes toward the principal. The mortgage rate at the time of purchase has a significant impact. And although there is a mortgage interest tax deduction, that mostly benefits wealthy households—about 75% of this tax break goes to households with incomes over $200,000 a year.
Mortgage rates fell from 1981 through 2021. They have begun to rise again in recent years but remain significantly lower than they were in the '80s and early '90s.
30-Year Fixed Rate Mortgage Average in the US, 1971–2026
To get a better picture of the true cost of owning a home, instead of looking at the price-to-income ratio, we can look at the percentage of income that would be spent on a mortgage payment. To estimate this, let's say that homebuyers make a 20% down payment and take out a 30-year loan at the historical average rate. This is just a rough estimate—not everyone needs financing, some people get better rates for shorter loans, etc.—but this will give a rough idea of what the typical loan burden would have been.
For example, in 1984 a 30-year loan for the median home price of $79,900 at the historical rate of 13.88% with a 20% down payment would have had an annual payment of $9,016 (ignoring PMI, taxes, etc.) which was 40% of the median income of $22,420. If we perform this same evaluation for each year in the four decades that followed, we have a downward trend.
Computed Annual Loan Payment at Average Mortgage Rate for Median Home Price as Percent of Median Income, 1984–2024
Source: Census Bureau via FRED (Income, Price), Bankrate, Freddie Mac (Rate)
In a blog post from 2023, the Federal Reserve Bank of St. Louis noted that the percentage of disposable personal income spent on mortgage debt service payments had been falling since 2010 and continued to remain low even as mortgage rates started to edge back up in recent years.
Houses Are Better Today
Another factor that complicates housing cost comparisons is that homes built today aren't the same as homes built decades ago. They're bigger and have more amenities.
Back when I first started looking for a home, I was drawn to historic neighborhoods where I enjoyed walking and biking, where it was pleasant and the architecture was stylish. Yet touring these beautiful old houses, I regularly noticed what they lacked. Many had no air conditioning and the insulation was poor. They often had no garage or a detached garage without power. There were fewer bedrooms than modern homes and very limited closet space.
In 1960, 16.8% of homes still lacked complete plumbing. By 1990 that number had dropped to 1.1%.
In the mid-1970s, less than half of new single-family houses had air conditioning. Now 98% have do.
In 1973, 40% of new single-family homes had one and a half bathrooms or less. In 2025, 95% had two or more bathrooms. Likewise, the number of bedrooms has grown. And the median square footage has risen by about 55%.
Homeownership Isn't Easy
I'm not arguing that homeownership is easily obtainable for everyone. Just that it's not impossible.
I purchased my first home on my own at the age of 27. Prior to that, I lived with roommates or in small, inexpensive apartments. My goal had been to avoid having to pay private mortgage insurance, so I budgeted and gradually set aside money for over 5 years until I had enough funds available for a 20% down payment. It took some discipline, but it was manageable.
I'm lucky that I live in the Midwest where housing is more affordable. I'm also lucky that I had access to a mortgage rate that was much lower than in the past century.
Each generation has its challenges, from high mortgage rates to high home prices. The data doesn't back the catastrophic view that young people can no longer afford homes. The low expectation that the young can't meet the challenges of their generation hasn't stopped them from doing so.
You're probably thinking that someone was having a little bit of fun with double exposures. But a long time ago, these photos were presented as evidence of ghosts.
Spirit photography began in the early 1860s. Patrons would sit for their photograph and the picture that developed would include additional ghostly figures, often draped in flowing cloth. The photographer would assert that these were "spirit extras" or ghosts of deceased relatives.
One such photographer, Édouard Isidore Buguet, was tried for fraud in the 1870s. He confessed to using double exposures. And authorities obtained the props that he used:
The police seized all the paraphernalia in the studio of Buguet and took it to court. Amongst it was a lay figure and a large stock of heads. These with dolls and assistants at the studio took turns as inspirations for Spirit extras.
And yet, his victims continued to believe they had experienced something supernatural. In his book, A Magician Among the Spirits, Harry Houdini notes that:
Witness after witness—journalist, photographic expert, musician, merchant, man of letters, optician, ex-professor of history, Colonel of Artillery, etc., etc.—came forward to testify on behalf of the accused.
Shockingly, this type of photographic trickery continued for decades. As late as the 1920s, people like author Sir Arthur Conan Doyle were still publicly professing a belief that cameras could capture images of the supernatural. But skeptics like Houdini pushed back, making efforts to debunk various forms of Spiritualism. To demonstrate that spirit photographs were hoaxes, Houdini produced his own, like this one where he convenes with the "ghost" of Abraham Lincoln.
Harry Houdini convenes with the "ghost" of Abe Lincoln Source: Library of Congress
Today it's obvious that these kinds of photos are fakes. As cameras became more prevalent, people became more familiar with them and with effects like double exposures and lens flares.
But the mystery of the unfamiliar photograph lives on. Earlier this month, the Pentagon released a collection of declassified files related to reports of Unidentified Aerial Phenomena (UAP). Public figures like Bill Maher have expressed a belief that aliens are involved. While skeptics like Michael Shermer push back, noting that "absolutely nothing stands out beyond the usual blurry photographs, grainy videos, artist reconstructions, and countless stories about weird things in the sky and in space."
Similar to how difficult it was to understand the first superimposed photographs back in the 1860s, it's hard to understand the optical illusions that are a part of air and space travel today. Pilot and astronaut Scott Kelly has discussed just how challenging it can be:
In my experience of flying over 15,000 hours in 30 something years in airplanes and in space, the environment that we fly in is very conducive to optical illusions...
My brother Mark Kelly, a former NASA astronaut and also now a U.S. Senator, shared a story with me about an experience he had years ago that when he was the commander of STS 124; they were getting ready to close the payload bay doors of the Space Shuttle and they see something in the payload bay and they thought it was a tool, maybe a bolt—they couldn’t quite figure it out—and they were potentially going to have to go and do a spacewalk to retrieve it. But before they did that my brother grabbed the camera and they took a picture of it, and when they blew up the picture they realized that this is not a bolt or a tool in the payload bay; it was actually the International Space Station that was 80 miles away.
There are cases where pilots have rendezvoused on a buoy because they thought that was their wingman. It’s just a very very challenging environment to work, especially at night.
In another hundred years, will people look back and laugh at how anyone ever thought UAP footage represented aliens? I think that's likely. It's also likely we'll be on the edge of yet another unknown frontier, with another set of unfamiliar photographs that we don't yet fully understand.