No, It's Not Impossible for Younger Generations to Own a Home
For over a decade now, I've been hearing friends say things like, "it's impossible for young people to buy a home today."
But is it?
Median Homeowner Age
The median homeowner age was 47 in 1960. It fell for a while but has been slowly climbing since 1990 and is now almost 53.
One reason for this is that people are living longer. Baby boomers began to enter adulthood in 1964. Life expectancy has increased by about 10 years since then. Older adults are now "aging in place," living in their homes and staying independent for as long as possible.
Another reason for the age shift is that more young people are going to college. College enrollment has grown from 45% in 1960 to 63% today. A larger proportion of young people are deferring their first home purchase until after they've finished their education, which pushes the median homeowner age upward.
Homeownership by Age
While there has been a decline in homeownership rates for most age groups in recent decades, this has been a gradual change with ups and downs. 35- to 45-year-olds have seen the largest drop. For homeowners under the age of 35, annual homeownership rates have remained relatively flat, hovering around 40% since 1970.
For homeowners under 35, the 2025 rate is nearly identical to what the rate was during a downturn back in the mid 90s.
| Age | 1994 | 2025 |
|---|---|---|
| 65+ | 77.4% | 78.6% |
| 55–64 | 79.3% | 75.9% |
| 45–54 | 75.2% | 69.8% |
| 35–44 | 64.5% | 60.8% |
| < 35 | 37.3% | 37.0% |
A more granular breakdown of homeowners under the age of 50 shows that things have been improving since a low point in 2016. Younger householders have been fueling that increase, and those under 25 have actually been doing better this century than in the 1980s and '90s.
For over forty years now the ownership rate has shown a consistent pattern of being higher for older age brackets. This makes sense. As people age, they tend to learn new skills, gain more experience, and earn more money. They've also had more time to save for a down payment. That was true in the 1980s and it's still true today.
Here again is a comparison of the current rates with 1994, this time broken down by homeowners under age 50. The rates are slightly lower for most age groups, though they have improved for those under 25.
| Age | 1994 | 2025 |
|---|---|---|
| 45–49 | 73.8% | 68.5% |
| 40–44 | 68.2% | 64.4% |
| 35–39 | 61.2% | 57.4% |
| 30–34 | 50.6% | 46.6% |
| 25–29 | 34.1% | 33.3% |
| < 25 | 14.9% | 24.2% |
First-Time Homebuyer Age
In late 2025, many news outlets cited a National Association of Realtors (NAR) survey which estimated that the median first-time homebuyer age had reached an all-time high of 40. However, NAR's data is out of line with Census Bureau data and according to Redfin the "typical first-time homebuyer was 35 years old in 2025, down from 36 the year before and down from a peak of 38 in 2018."
The American Enterprise Institute puts the number even lower. Using anonymized mortgage loan data to determine the median age of first-time homebuyers, they estimate that for the first quarter of 2026 the median age of first-time buyers obtaining a loan was 33. Loan data also show that the median age of first-time homeowners has been under 35 for the past twenty years.
Affordability
So far we've seen that the median homeowner age has risen slightly in the past 30 years, young people are still buying homes at roughly the same rate they always have, and Census and loan data show that first-time buyers still tend to be in their mid-thirties. What about cost?
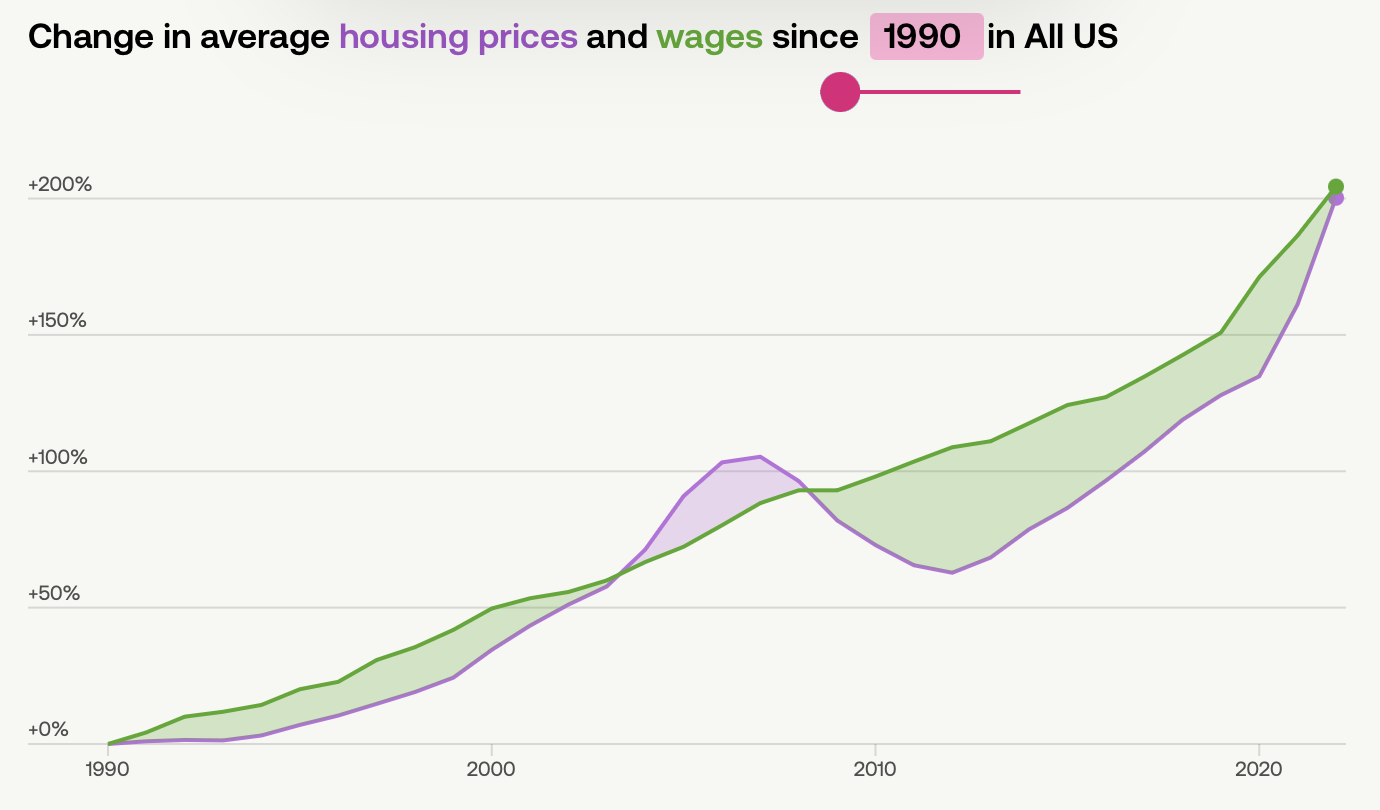
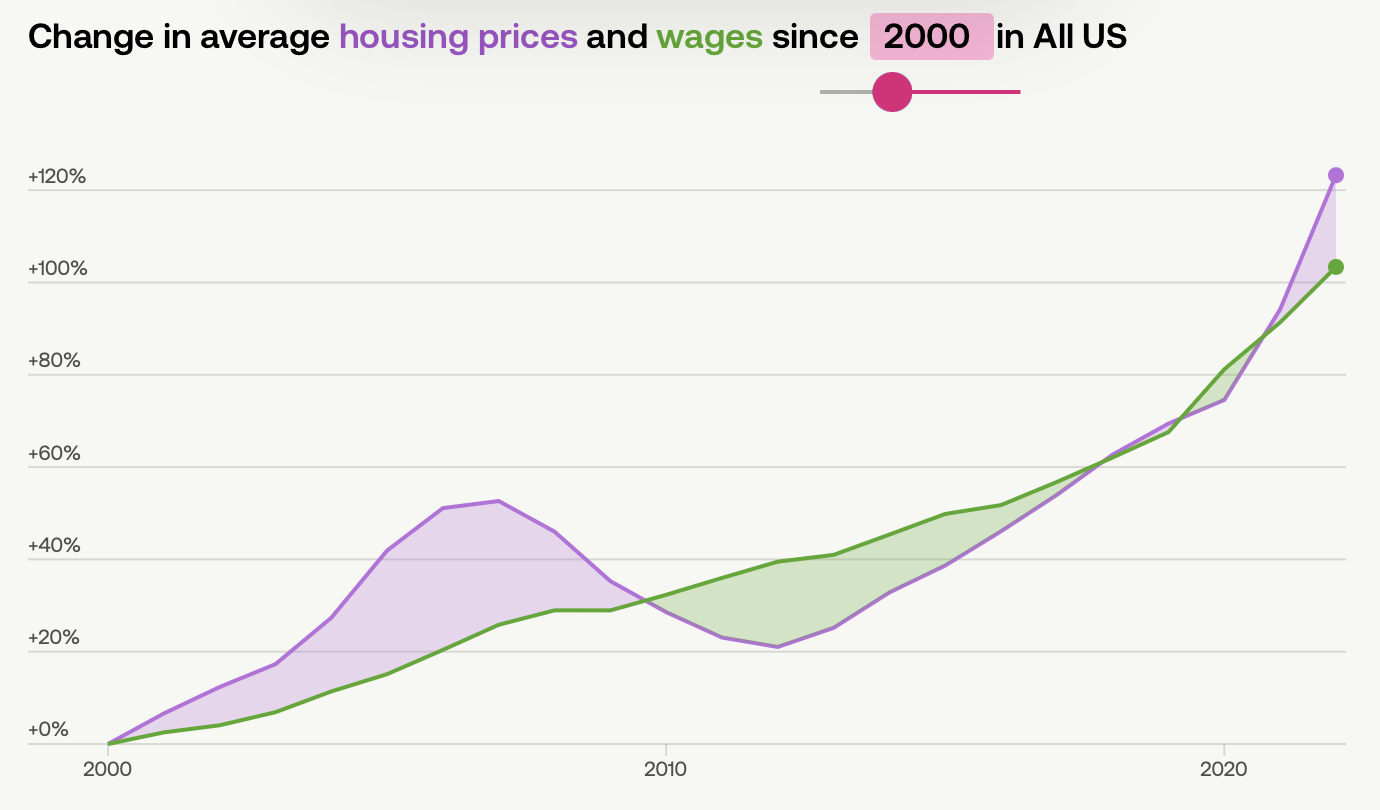
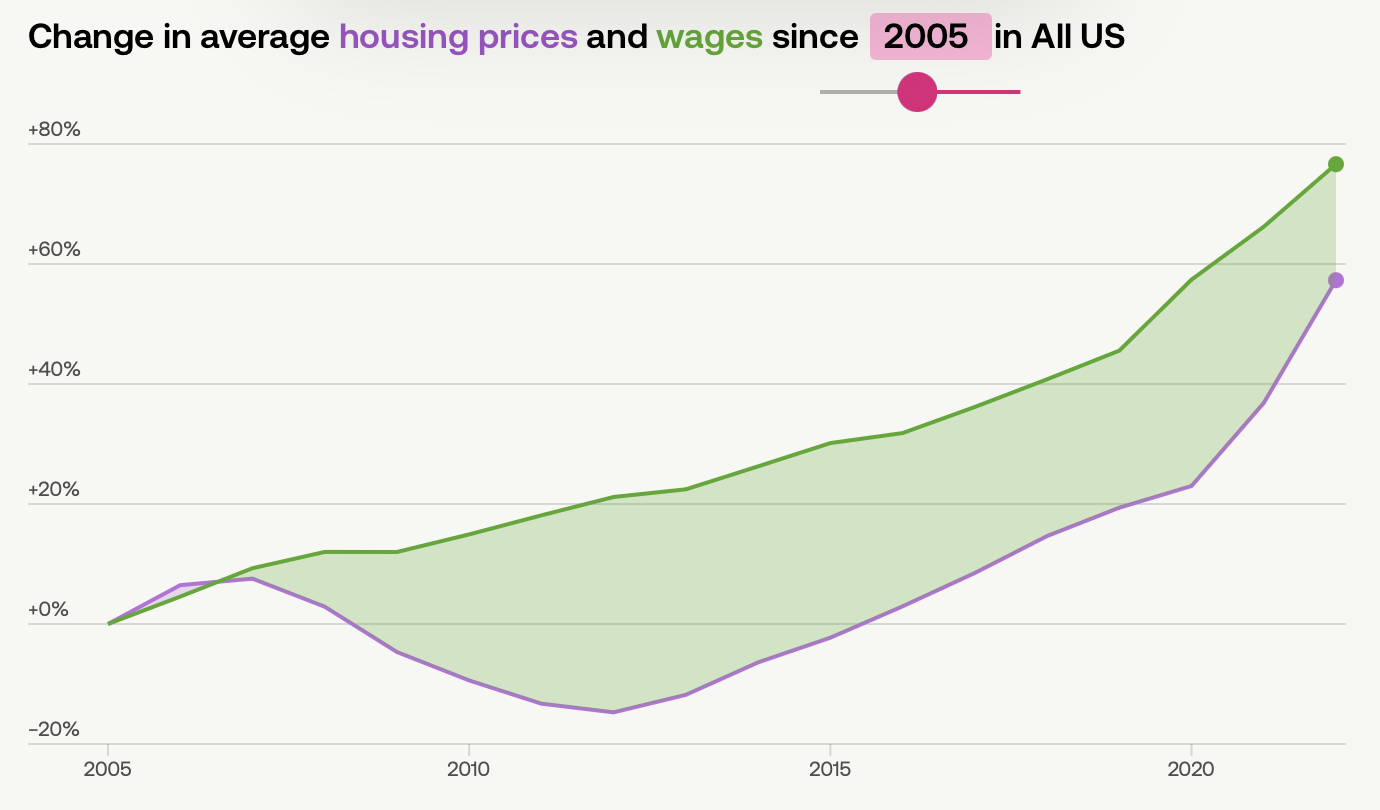
The Federal Housing Finance Agency's (FHFA) House Price Index (HPI) measures the average price changes in single-family homes. HPI measures the rate of appreciation or depreciation rather than a specific dollar amount. USAFacts has some great interactive charts comparing the changes in HPI and wages over time.
If you start the clock in 1990, changes to wages have outpaced house prices:
If you start in 2000, house prices have outpaced wages:
If you start in 2005, it's the reverse:
If you start in 2010, it's the reverse again:
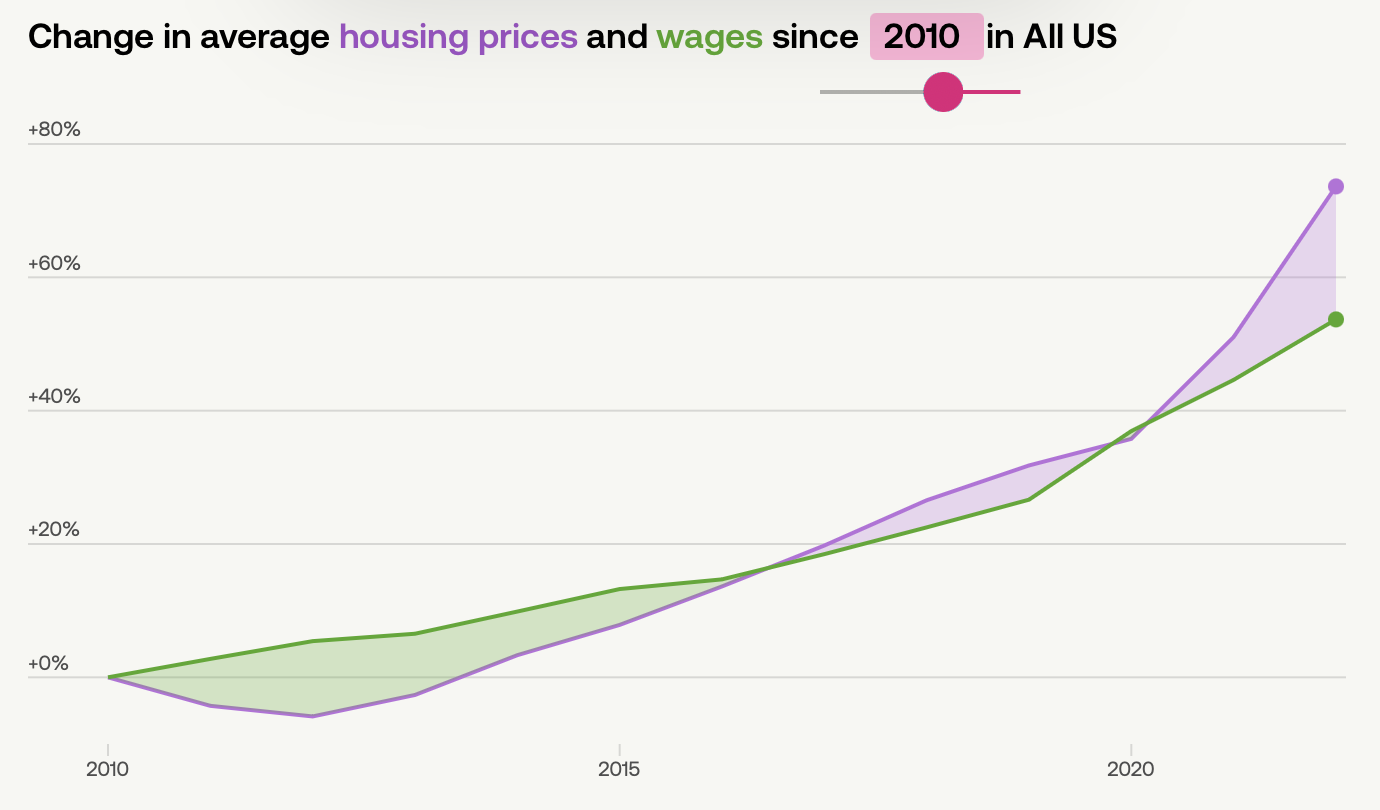
And so far, that trend has continued ever since. Even though housing costs have been outpacing wages for over 15 years now, does this mean that mean that homes are unaffordable or "impossible" to purchase?
One way to try to measure affordability over time is to examine the price-to-income ratio. The median home price was about 4 times the median household income back in the late '80s and early '90s. It's about 5 to 6 times the median household income today.
You'll sometimes see this metric in stories about how housing is becoming unaffordable. But there are several problems with using price-to-income to gauge affordability.
First, housing prices and incomes vary greatly by region. In the Midwest, median home prices tend to be lower, and median incomes tend to be higher than the national values. If we compute the price-to-income ratio just for the Midwest, then the upward trend is much more gradual. For the Midwest the median home price was 3.3 times the median family income in 1993, and it still was in 2020.
The Midwest has consistently had higher homeownership rates than other regions of the country for more than half a century.
The second and more important problem with the price-to-income ratio is that it doesn't take into consideration the impact of lending costs. Mortgage rates have an enormous impact on the actual cost of purchasing a home.
The average mortgage rate in 1984 was 13.88%. The median home price was $79,900. Even with a down payment of 20%, the total interest owed on a 30-year loan was $206,549 which is 2.6 times the home price itself.
The average mortgage rate in 2025 was 6.66% and the median home price was $417,400. If a buyer took out a 30-year loan with a 20% down payment, then the total interest would be $438,590 which is 1.1 times the home price.
While it's true that loans can be refinanced over time, most of the interest is paid on the front-end. At a rate of 13.88%, in the first year of payments, $8,863 goes toward interest and just $153 goes toward the principal. The mortgage rate at the time of purchase has a significant impact. And although there is a mortgage interest tax deduction, that mostly benefits wealthy households—about 75% of this tax break goes to households with incomes over $200,000 a year.
Mortgage rates fell from 1981 through 2021. They have begun to rise again in recent years but remain significantly lower than they were in the '80s and early '90s.
To get a better picture of the true cost of owning a home, instead of looking at the price-to-income ratio, we can look at the percentage of income that would be spent on a mortgage payment. To estimate this, let's say that homebuyers make a 20% down payment and take out a 30-year loan at the historical average rate. This is just a rough estimate—not everyone needs financing, some people get better rates for shorter loans, etc.—but this will give a rough idea of what the typical loan burden would have been.
For example, in 1984 a 30-year loan for the median home price of $79,900 at the historical rate of 13.88% with a 20% down payment would have had an annual payment of $9,016 (ignoring PMI, taxes, etc.) which was 40% of the median income of $22,420. If we perform this same evaluation for each year in the four decades that followed, we have a downward trend.
In a blog post from 2023, the Federal Reserve Bank of St. Louis noted that the percentage of disposable personal income spent on mortgage debt service payments had been falling since 2010 and continued to remain low even as mortgage rates started to edge back up in recent years.
Houses Are Better Today
Another factor that complicates housing cost comparisons is that homes built today aren't the same as homes built decades ago. They're bigger and have more amenities.
Back when I first started looking for a home, I was drawn to historic neighborhoods where I enjoyed walking and biking, where it was pleasant and the architecture was stylish. Yet touring these beautiful old houses, I regularly noticed what they lacked. Many had no air conditioning and the insulation was poor. They often had no garage or a detached garage without power. There were fewer bedrooms than modern homes and very limited closet space.
In 1960, 16.8% of homes still lacked complete plumbing. By 1990 that number had dropped to 1.1%.
In the mid-1970s, less than half of new single-family houses had air conditioning. Now 98% have do.
In 1973, 40% of new single-family homes had one and a half bathrooms or less. In 2025, 95% had two or more bathrooms. Likewise, the number of bedrooms has grown. And the median square footage has risen by about 55%.
Homeownership Isn't Easy
I'm not arguing that homeownership is easily obtainable for everyone. Just that it's not impossible.
I purchased my first home on my own at the age of 27. Prior to that, I lived with roommates or in small, inexpensive apartments. My goal had been to avoid having to pay private mortgage insurance, so I budgeted and gradually set aside money for over 5 years until I had enough funds available for a 20% down payment. It took some discipline, but it was manageable.
I'm lucky that I live in the Midwest where housing is more affordable. I'm also lucky that I had access to a mortgage rate that was much lower than in the past century.
Each generation has its challenges, from high mortgage rates to high home prices. The data doesn't back the catastrophic view that young people can no longer afford homes. The low expectation that the young can't meet the challenges of their generation hasn't stopped them from doing so.